The leg was then brought from maximal knee extension to maximal knee flexion to assess preoperative ROM, which indicates inherent flexion contracture or hyperextension. Varus-valgus measurements of the knee were then generated as part of the navigation software protocol. These measurements were obtained without additional varus or valgus stress applied to the knee and before any bony resection. The rest of the operation was completed using navigation to guide bony resection and soft-tissue balancing. The final components used were all cemented cruciate-substituting TKA implants. After component insertion, the knee was again brought through ROM from maximal knee extension to maximal knee flexion to assess postoperative ROM before wound closure.
Extension and Flexion Varus
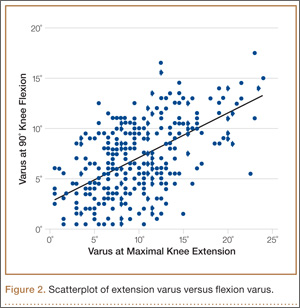
As none of the patients in the flexion varus dataset (range, –0.5° to –19°) had a varus deformity of more than 20° at 90° flexion, we used a cutoff of 10° to divide these patients into 2 subgroups: less than 10° (237 knees) and 10° or more (80 knees). The extension varus dataset ranged from –0.5° to –24°. Incremental values of –0.5° to –24° in this dataset were then analyzed against the 90° flexion varus subgroups using logistic regression. A scatterplot of the relationship between extension and flexion varus is shown in Figure 2. The probability function was then derived and a probability graph plotted.
FFD and Extension and Flexion Varus
Maximal knee extension, obtained from intraoperative navigation measurements, ranged from –9° (hyperextension) to 33° (FFD) and maximal knee flexion ranged from 90° to 146°. Ninety-two knees had slight hyperextension, and 6 were neutral. Of the 317 OA knees with varus deformity, 219 (69%) had FFD. This sagittal plane alignment parameter was analyzed against coronal plane alignment in maximal knee extension and 90° knee flexion to determine if increasing severity of FFD corresponds with increasing extension or flexion varus.
Statistical Analysis
Statistical analysis was performed with Stata 10.1 (Statacorp, College Station, Texas). Significance was set at P < .05.
Results
Extension and Flexion Varus
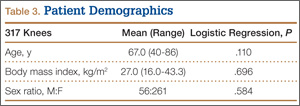
Patient demographic data are listed in Table 3. Univariate logistic regression analysis revealed that age (P = .110), body mass index (P = .696), and sex (P = .584) did not affect the association between preoperative extension and flexion varus.
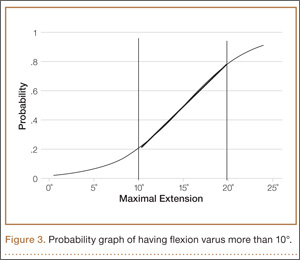
Mean (SD) preoperative extension varus was –9.9° (4.80°), and mean (SD) preoperative flexion 90° varus was –7.02° (3.74°). Linear regression of the data showed a significant positive correlation between preoperative extension varus and flexion varus (Pearson correlation coefficient, 0.57; P < .0001). The probability function was determined as follows: Probability of having flexion varus of more than 10° = 1 / (1 + e–z), where z = –4.014 – 0.265 × extension varus. Plotting the probability graph of flexion varus against varus angles at maximal knee extension from the probability formula yielded a sigmoid graph (Figure 3). The most linear part of the graph corresponds to the 10° to 20° of extension varus (solid line), demonstrating an almost linear increase in the probability of having more than 10° flexion varus with increasing extension varus from 10° to 20°. For extension varus of 20° or more, the probability of having flexion varus of more than 10° approaches 1.
FFD and Extension and Flexion Varus
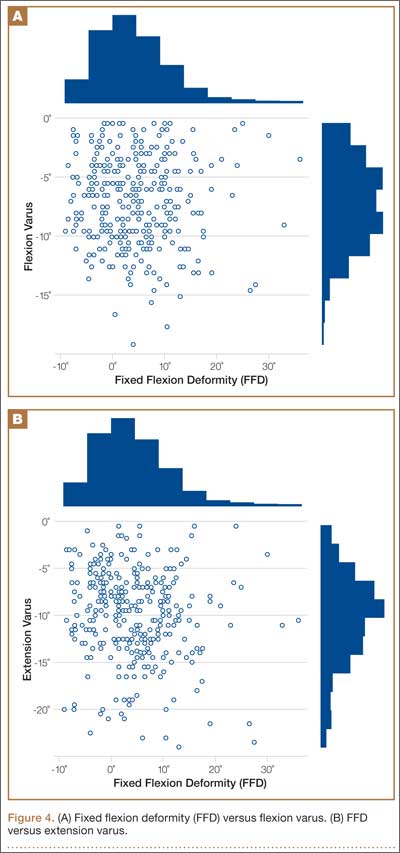
Mean (SD) preoperative maximal knee extension (analogous to FFD) was 4.41° (7.50°), mean (SD) extension varus was –9.9° (4.80°), and mean (SD) 90° flexion varus was –7.02° (3.74°). We did not find any correlation between preoperative FFD and preoperative flexion varus (r = –0.02; P = .6583) or extension varus (r = –0.11; P = .046) (Figure 4).
Postoperative Alignment
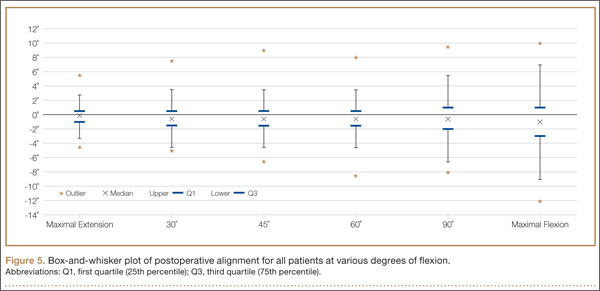
Of the 317 OA knees, 18 had incomplete navigation-acquired postoperative alignment data. The postoperative alignment of the other 299 knees at various degrees of knee flexion is illustrated with a box-and-whisker plot (Figure 5).
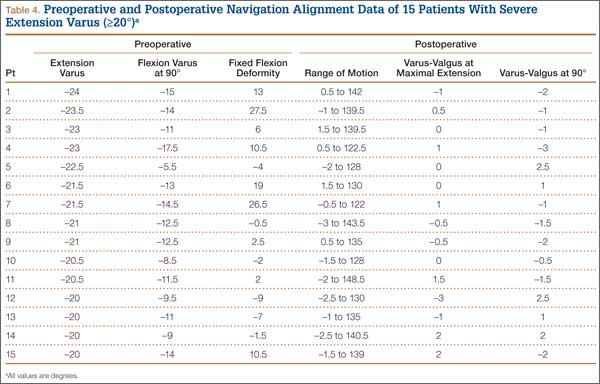
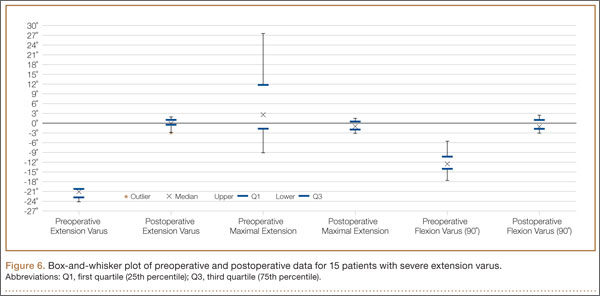
Knees With Severe Extension Varus
Fourteen of the 15 knees with severe extension varus (>20°) had flexion varus of more than 9° (range, –9° to –17.5°, with only 1 outlier, at –5°). For the 15 patients, maximal knee extension ranged from –9° hyperextension to 27.5° FFD. Six knees had slight hyperextension, and 9 had FFD demonstrating large variability in sagittal alignment. Despite severe preoperative coronal deformity, all 15 knees had satisfactory deformity correction. Preoperative and postoperative knee alignment data for these 15 knees appear in Table 4 and Figure 6, respectively.