Sites With Elevated Eosinophil Levels
In addition to descriptive statistics, Pearson χ2 tests were initially performed to determine whether the proportions of elevated eosinophil levels at inland VASDHS sites in San Diego and Imperial counties deviated significantly from the expected levels at the coastal La Jolla hospital comparison site. Additional Pearson χ2 tests were performed subsequently to compare all sites involved in the study against all other sites. The goal of these Pearson χ2 tests was to identify potential sites for further investigation with no adjustment made for multiple testing. Sites with eosinophil levels significantly higher or lower than the expected levels when compared with the other sites included in the study were investigated further with a chart review.
Based on the VA Clinical Laboratory standards, a peripheral eosinophil percentage > 3% was considered elevated. Absolute eosinophil levels also were calculated to determine whether elevated eosinophil levels were associated with absolute counts reflective of eosinophilia. Counts of 500 to 1,499 eosinophils/mL were considered mild eosinophilia, 1,500 to 4,999 eosinophils/mL considered moderate eosinophilia, and ≥ 5,000 considered severe eosinophilia.9
Site-Specific Subgroup Analysis
A structured chart review was conducted for all patient notes, laboratory findings, studies, and communications for sites identified with elevated eosinophil levels. Demographic information was collected for all subjects, including age, race, occupation, and gender. Each record was systematically evaluated for information relating to possible causes of eosinophilia, including recent or prior data on the following: CBC, eosinophil percentage; HIV, C immitis, or Strongyloides stercoralis serology, stool ova and parasites, diagnoses of dyslipidemia, diabetes mellitus, malignancy, or adrenal insufficiency; and histories of atopy, allergies, and/or allergic rhinitis. In addition, given the unique exposures of the veteran population, data on service history and potential exposures during service, such as to Agent Orange, also were collected.
A multivariate analysis using logistic regression was conducted to determine whether conditions or exposures often associated with eosinophilia might explain any observed elevations in eosinophil levels. For the logistic regression model, the response variable was eosinophil levels > 3%. Explanatory variables included parasitic infection diagnosis, including C immitis, dyslipidemia diagnosis, malignancy diagnosis, allergy and/or atopy diagnosis, and HIV diagnosis. In addition, the analysis controlled for demographic variables, such as age, sex, race, period of service, and Agent Orange exposure and were included as explanatory variables in the model. Categorical variables were coded as 0 for negative results and 1 for positive results and were identified as missing if no data were recorded for that variable. Statistics were performed using Stata 13 (College Station, TX).
Results
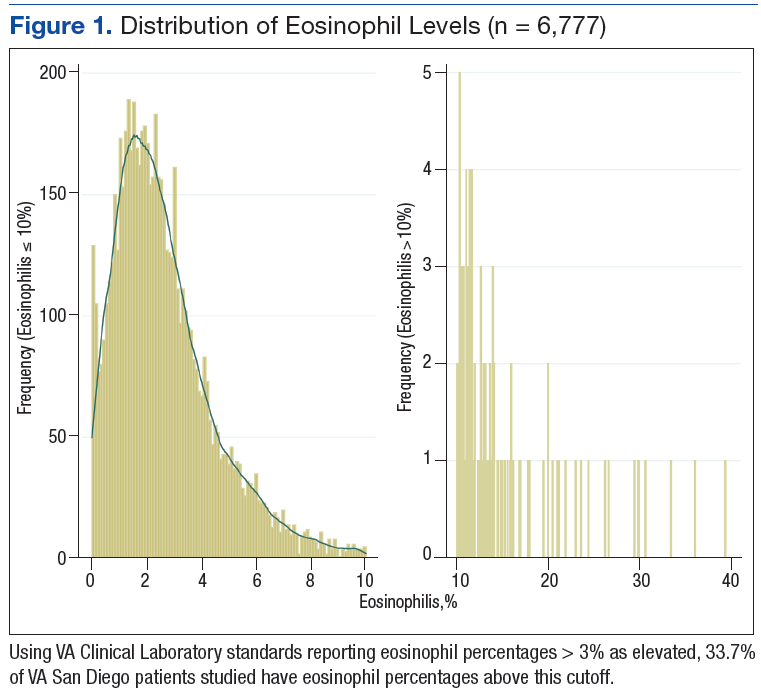
A total of 6,777 VASDHS patient records were acquired. Two records included CBC without differentials and were omitted from the study. Among those included, the median eosinophil percentage was 2.3% (SD 2.51). Eosinophil percentages ranged from 0% to 39.3%. The 25th percentile and 75th percentile eosinophil levels were 1.3% and 3.6%, respectively. Nine percent of patients had percentages below 11.6%, and 4 patients had eosinophil percentages ranging from 30% to 39% (Figure 1).
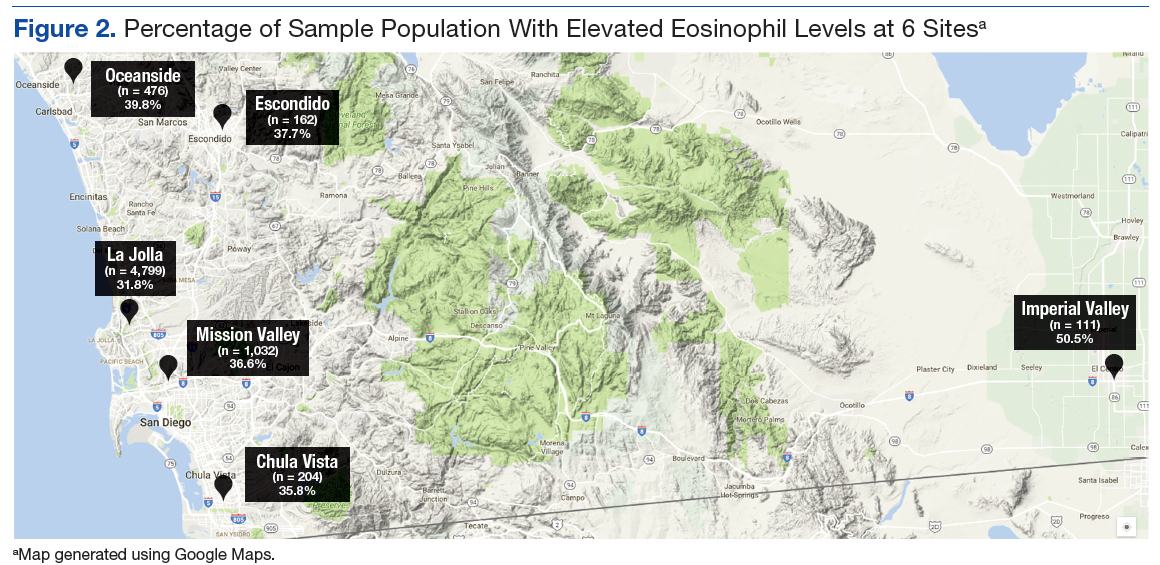
Grouping the records by clinic, 30% to 40% of patients had elevated eosinophil levels at all sites except for Imperial Valley (Figure 2). At the Imperial Valley site, 50.5% of patients had elevated eosinophil levels, which was statistically higher than those of all other sites (Figure 3).
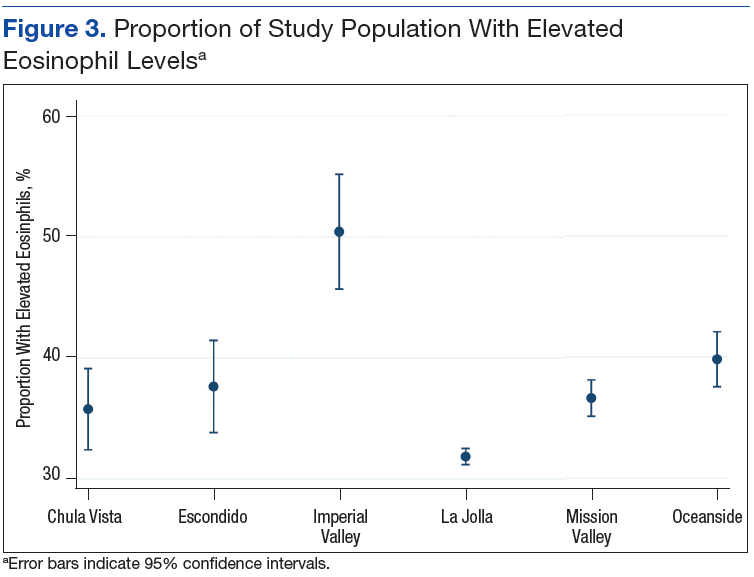
The authors tested the null hypothesis that there is no association between geographic location and the proportion of the population with elevated eosinophil levels. A Pearson χ2 test of the proportion of elevated eosinophil level (P < .001) indicated that the observed differences in elevated eosinophil levels were unlikely due to chance. Further sets of exploratory χ2 tests comparing only 2 sites at a time identified Imperial Valley as differing significantly from all other sites at α = .05. Eosinophil proportions at the Mission Valley (P = .003) and Oceanside (P < .001) sites also were found to differ significantly from the La Jolla site. In contrast, eosinophil proportions at the Escondido (P = .199) and Chula Vista (P = .237) sites did not differ significantly from those of the La Jolla site using χ2 testing.
Imperial Valley Clinic
Records were acquired for 109 patients at the Imperial Valley clinic (107 male and 2 female). Fifty-five patients (50.5%) were identified as having elevated eosinophil levels. However, only 5 patients were classified as having mild eosinophilia. No patients were found to have moderate or severe eosinophilia (Table 1).
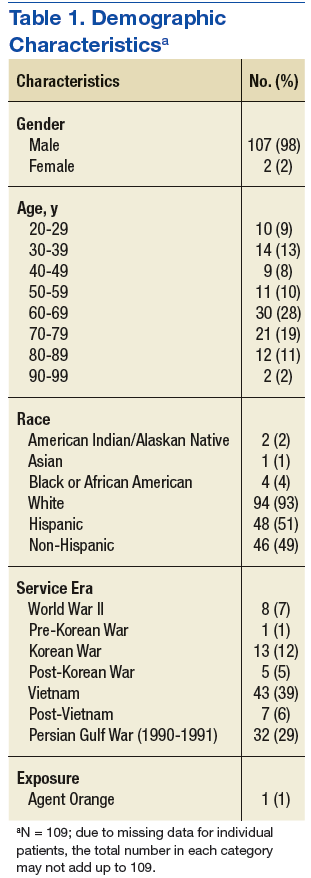
On review of the data for Imperial Valley patients, 68 had a diagnosis of dyslipidemia and 17 had asthma, atopic dermatitis, allergic rhinitis, and/or atopy not otherwise specified diagnoses. Three patients were identified with diagnoses of malignancies or premalignant conditions, including 1 patient with chronic lymphocytic leukemia, 1 patient with renal cell carcinoma with metastasis to the lungs, and 1 patient with myelodysplastic syndrome. No patients were identified with a diagnosis of HIV. There were no diagnostic laboratory tests on record for C immitis serology, stool ova and parasites, Strongyloides stercoralis serology, or clinical diagnoses of related conditions.
Logistic regressions assessed whether elevated eosinophil levels > 3% might be explained by predictor variables, such as a history of dyslipidemia, malignancy, or asthma/allergies/atopy (Table 2). As no parasitic infections or HIV diagnoses were identified in the patient population, they were noncontributory in the model. The probability of obtaining the χ2 statistic given the assumption that the null hypothesis is true equals .027 for the model, suggesting that the overall model was statistically significant at the α = .05 level.
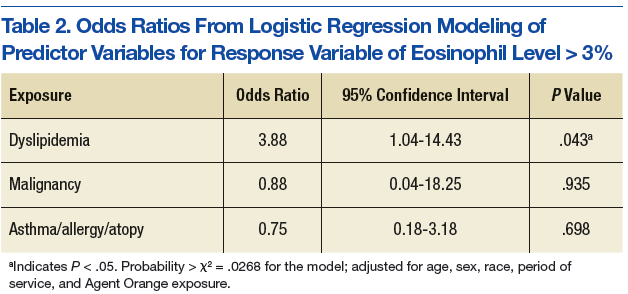
Of the key predictor variables of interest, only dyslipidemia was found to predict elevated eosinophil levels. Patients with a diagnosis of dyslipidemia were found to have nearly 4 times greater likelihood of having elevated eosinophil levels compared with patients without dyslipidemia (odds ratio 3.88, 95% confidence interval: 1.04-14.43). Patients with malignancy or a history of asthma, allergy, or atopy were not found to have significantly different odds of having elevated eosinophil levels compared with baseline within the study population.